" Price is what you pay. Value is what you get "
- Warren Buffett, CEO, Berkshire Hathaway
In his annual letter to company shareholders1 recently, Buffett noted that almost all the businesses he wanted to acquire in 2017 were just too expensive. ‘A sensible purchase price’ was hard to come by, he wrote, as prices for even ‘decent businesses’ hit an all-time high.
Buffett’s lament underscores one of the biggest challenges faced by entrepreneurs — calculating valuations for their businesses that are both attractive and realistic. Reliable valuations are critical for businesses as both over-valuing and under-valuing can spell potential disasters.
While the overall value of a business is determined by factors such as financial performance, projected sales, assets and customer reach, it can be tricky to accurately value intangibles such as human and intellectual capital.
Add a plethora of valuation models to the mix (each with its own limitations) and the challenge of discovering the true value of a business is amplified.
Case Study
A Leading Online Travel Agency Increases Revenues by 16 Percent with Actionable Analytics
Read More
For Online Travel Agencies (OTAs), their complex business models make the valuation exercise even more challenging. The business models of OTAs are defined by a variety of pricing models, numerous customer outreach channels, alternate revenue streams, management of large amounts of inventory and multiple vendors, and massive investments in next-gen tools and apps. Hence, an increasing number of OTAs are exploring holistic approaches that can help them compute agreeable valuations for their business.
 The Valuation Game: Methods & Models
There are multiple reasons why OTAs want to objectively determine the value of their business. For some, knowing their company’s current value gives them a strong footing while negotiating for financial backing / investments. For others, a fair value, computed using an established valuation method, helps provide an objective and transparent view to potential buyers.
In the current OTA ecosystem, the top two players own 75-90 percent2 of the market in the U.S., leaving the remaining players to compete for a smaller slice of the pie. High commission rates, service fees and disproportionate advertising spends add to the challenges. It is not surprising, therefore, that at least some OTAs are aiming for significant returns on their investments by selling off their attractively valued business.
So, let’s take a look at some OTA-specific valuation models that exist today.
Case Study
A Leading European OTA Achieves USD 7 Million in Incremental Sales
Read More
Recast Profit Model: In this model, an OTA’s valuation is determined by multiplying its recast profits3 [Earnings Before Interest, Taxes, Depreciation and Amortization (EBITDA)] for the last 12 months with a mutually agreed upon multiple (between buyer and seller). In the current market scenario, most potential buyers offer a multiple between three and four. For example, an OTA with recast profits of USD 100,000 will attract offers starting from USD 300,000.
Sales EBIT Model: Smaller OTAs can be valued by multiplying their [Earnings Before Interest and Taxes (EBITs)] with a factor of either two or three using this model. For larger OTAs, the multiplying factor can range from three to five.4 Often, the value of the OTA business is pegged at 45-50 percent of its annual gross profits.
Discretionary Model: This approach involves valuing an OTA by multiplying its Seller’s Discretionary Earnings (SDE — profits with certain expenses added back to give a more accurate picture of the profit-making potential of the business) with a multiple of either two or three. Some assessors also add the current value of the OTA’s available inventory to the multiplied SDE amount to arrive at a truer value for the business.
Discounted Cash Flow Model (DCF): In this method, a company’s future free cash flow projections are adjusted (discounted) for the Time Value of Money (TVM) and added to arrive at its current valuation. While DCF is a financially sound model for valuation, it has its limitations. For example, the valuation’s accuracy is largely determined by the quality of assumptions used for variables such as future free cash flow.
These assumptions are subjective in nature and may lead to different valuations by different analysts. The value derived is also extremely sensitive to input variables — even minor variations in the inputs to the model can significantly skew the company’s valuation.
Dividend Discount Model (DDM): In this model, a company’s valuation is determined by assessing the present value of its stock by factoring in projected dividend growth and an associated discount rate. The model is based on the principle that the value of a stock is a function of the expected value of the cash flow it will generate in the future.
The DDM cannot be used for new companies that have fluctuating growth rates for dividends in the initial years (provided they give out dividends). Also, similar to the DCF model, the DDM’s output is again sensitive to variations in the inputs used for calculating valuations.
However, despite the availability of various valuation models, OTAs are still struggling to compute a fair value for their business. It is not difficult to see why — most standard models depend heavily on financial ratios, sales revenue and EBIT to determine valuations. But these are not the only indicators to compute sound valuations.
In order to decide on a fair value, it is important that the valuation approaches used for OTAs include a much wider set of variables. For example, in the digital age, digitized offerings and social media footprint can add significantly to an OTA’s business value.
The WNS approach proposed below factors in such aspects into the valuation exercise in addition to the usual hard numbers around revenues and future cash flow.
 The WNS Model of Valuation
The WNS model takes into consideration multiple factors to arrive at a holistic valuation approach. This effectively plugs the gaps in the models described earlier.
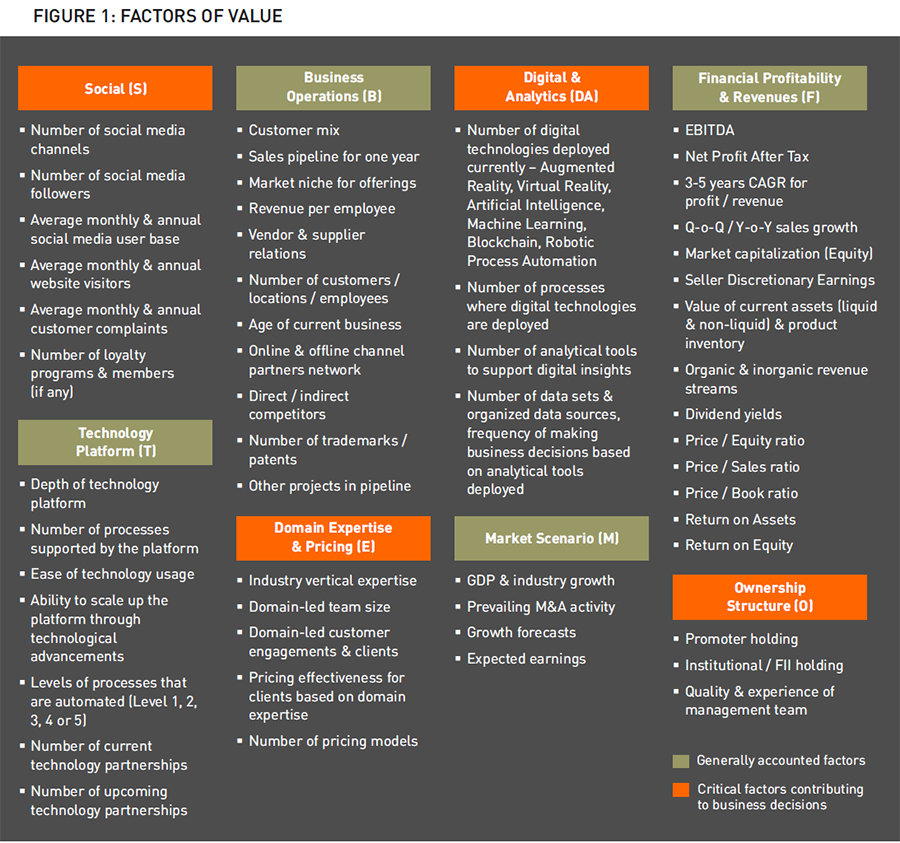
In Figure 1, we have listed these factors under relevant categories, namely, Technology Platform (T), Domain Expertise and Pricing (E), Financial Profitability and Revenues (F), Digital and Analytics (DA), Social (S), Business Operations (B), Ownership Structure (O) and Market Scenario (M).

While the individual components listed in Figure 1 are crucial in arriving at an OTA valuation, the WNS model clusters these components into various units with specific weightages assigned to each unit, based on their importance in the current ecosystem.
The weightages for the units add up to 100 percent. Thus, we have:
-
Technology Platform (T): 30 percent
-
Domain Expertise and Pricing (E): 20 percent
-
Financial Profitability and Revenues (F): 15 percent
-
Digital and Analytics (DA) along with Social (S): 10 percent each
-
Business Operations (B), Ownership Structure (O) and Market Scenario (M): 5 percent each
Since technology is a crucial factor for the survival of OTAs, the highest weightage is assigned to it followed by domain expertise and pricing – these two form the basic tenets of the OTA business.
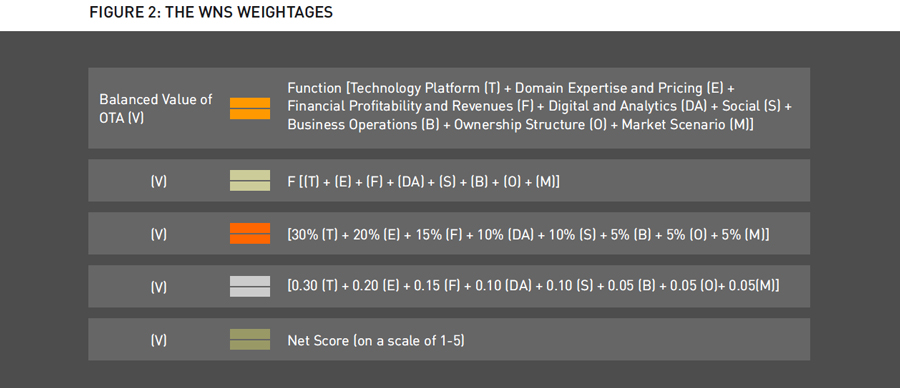
When plotted as a linear equation, the balanced or true value of an OTA, as a function of these eight factors, can be represented as shown in Figure 2.
Weightages can be applied as follows:
[30% (T) + 20% (E) + 15% (F) + 10% (DA) + 10% (S) + 5% (B) + 5% (O) + 5% (M)] = (0.30 + 0.20 + 0.15 + 0.10 + 0.10 + 0.05 + 0.05 + 0.05).
Overall values for the eight factors, T, E, F, DA, S, B, O and M, can be calculated by averaging the collective scores of their various elements. For example, under Technology Platform (T), the first element – depth of technology platform – can have a score between one and five. The higher the technological depth, the closer the score will be to five.
Similarly, the remaining five elements under ‘T’ will have scores between one and five depending on their maturity levels. The final value for ‘T’ is then computed by taking the average of the cumulative scores for all the elements.

Do note that the linear equation above is a suggested approach and the weightages assigned can be tweaked or reassigned based on the applicability of individual factors in the respective business.
The balanced value of an OTA (V), that is a net score, computed using this equation can range from one to five, with five being the best. If V is less than 2.5, it means that the OTA is not a good fit for potential acquisition. However, if V is higher than 2.5, then next steps for further due diligence can be taken.
The balanced valuations derived leveraging the WNS model can equip OTAs to tide over uncertainties such as partnership / shareholder disputes, changes in corporate structures or an unexpected rise in the number of potential buyers (thereby further spiking interest levels).
The WNS approach for OTA valuations will enable companies to take a step back, look at all the business imperatives and include relevant factors to arrive at their ‘true’ value.
Views on the valuation process are quite polarizing. At one end of the spectrum are those who firmly believe that valuation is a hard science based on structured metrics. At the other end are those who see it as an art, especially one where the data can be manipulated to influence the results. The answer, however, lies somewhere in the middle. OTAs need to tread this ground with caution and ensure that their valuations are as realistic as possible.
After all, ‘a sensible purchase price,’ as highlighted by Buffett, is all it takes to amiably seal the right deal.